Mapping Tool Showcases Research on Incidents in the Uyghur Homeland

January 21, 2016
Greg Fay, Manager, Uyghur Human Rights Project
The Uyghur Human Rights Project (UHRP) has released an online web map highlighting research from “Legitimizing Repression: China’s “War on Terror” Under Xi Jinping and State Policy in East Turkestan.” Based on an analysis of overseas media reports, the March 2015 investigation into incidents of violence and unrest from 2013-2014 counted a total death toll of 656 to 715 lives. The number of fatalities in 2014 is approximately double that of 2013, with a spike from April to July of 2014. Data in the report should not be considered definitive, as the Chinese government tightly controls information in East Turkestan. The numbers nevertheless indicate a deterioration in security conditions since Xi Jinping became Chinese president in early 2013. The webmap is online here.
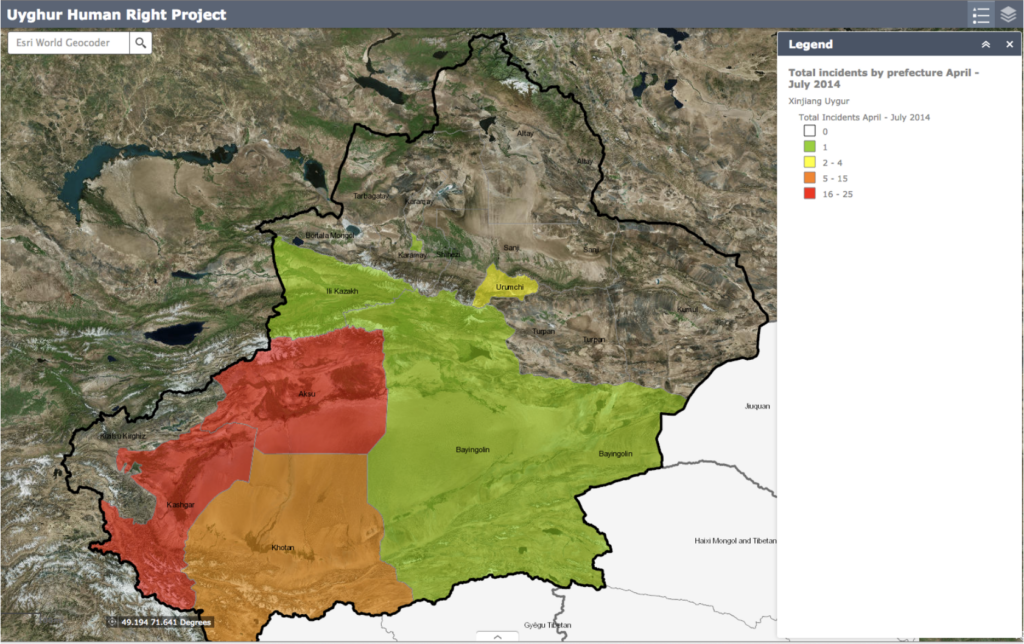
The new online webmap allows users to explore eleven maps, 6 showing prefecture level data, and 5 depicting data on the county level. To toggle between data sets on the map, simply clicking on the Layer icon at the top right of the map and select only one layer from the list. For each layer, click the Legend icon immediately to the left of the Layer icon to display a legend explaining the numbers corresponding to the map colors. The eleven maps include:
- Total Incidents by Prefecture
- Total Incidents by Prefecture from April-July 2014 (pictured above)
- Arrests by Prefecture
- Alleged “Terror” Incidents by Prefecture
- Fatalities by Prefecture
- Violent Incidents by Prefecture
- Total Incidents by County
- Total Incidents by County from April-July 2014
- Arrests by County
- Alleged “Terror” Incidents by County
- Fatalities by County
The interactive presentation of the data provides a valuable analytical tool to understand new events as they unfold. Users can utilize a search bar in the upper left part of the map to search for new cities, towns or villages, in order to look up the location of any new events and situate these locations in a recent historical and geographical context.
By showcasing data from 2013-2014 in the new online webmap, UHRP hopes to support a more robust understanding of future developments in the Uyghur homeland. UHRP is grateful to GISCorps, a nonprofit volunteer group which designed the maps for Legitimizing Repression in addition to creating the online module. Other key findings of the report include:
- There were 125 incidents overall from 2013-14, 89 of these were violent. UHRP selected incidents interpreted as “political” in which Uyghurs were killed, injured or arrested. Uyghurs were three times more likely than Han Chinese to be killed in the violence.
- The south of East Turkestan, a Uyghur majority area, was most heavily impacted. Kashgar Prefecture experienced the largest number of fatalities. Of the 327 deaths in Kashgar Prefecture, 199 occurred in Yarkand County. Aksu (79 fatalities) and Hotan (76 fatalities) recorded the second and third highest number of deaths among prefecture level administrative areas.
- In a troubling number of incidents police killed all alleged “perpetrators.” The possibility exists that excessive force and extrajudicial killings are a feature of the Chinese state’s security approach to incidents. In addition, a number of incidents recorded by UHRP appear to have been provoked by heavy-handed, or at best insensitive, policing.
- Chinese state media underreported incidents during 2013-14, reporting less than a third of the incidents. Over two thirds of the 37 incidents official media did report were labeled as “terrorism.”
Permalink: http://giscorps.maps.arcgis.com/apps/webappviewer/index.html?id=e69c1c5ddd7d400dad8e522ed1f6db7c
